¶ Bonding Curve Basics
A token bonding curve is a way to define a relationship between the prices of a reserve token and another token that is minted on demand. The reserve token acts as the monetary asset in the system, and the minted token is issued at a specified price paid in the reserve token. The bonding curve specifies the price of each minted token in terms of the current supply of the token.

The minted output token of the bonding curve is called a continuous token. Continuous tokens are so called because their price varies along a continuum as the supply of tokens fluctuates due to buying or selling. A price is defined for each supply level. Because the bonding curve defines a predetermined price at each supply level, the curve acts as an automatic market maker (AMM) for the token at every price level. The AMM guarantees liquidity for any buy or sell order because the token is minted or burned on demand and is backed by the supply of reserve tokens. The AMM is implemented by the mechanism of a bonding curve smart contract, which acts as the counterparty of each transaction. Continuous tokens do not have an explicit supply cap, since they can continue to be minted as long as the price for the next token to be minted is paid using the reserve token. The theoretical supply cap of a continuous token is therefore the number of continuous tokens that would be minted were the entire supply of reserve tokens deposited into the continuous token bonding curve, given the reserve ratio and other specific parameters of the bonding curve.
The price of a continuous token increases as the number of continuous tokens issued goes up. Each additional token issued costs more than the previous token. When continuous tokens are purchased, the price goes up. When they are sold, the price goes down. Different bonding curves provide different incentive structures for investing in the token. For example, in the quadratic curve above, tokens purchased early have a much lower price that grows gradually at first. This curve incentivizes early adopters to buy the token. The token price is not only more expensive with increasing supply but also increases more rapidly in price as the supply grows. Investors who buy early can sell their tokens back at a profit if the supply increases beyond the level where they entered.
When a buyer specifies a number of tokens to buy, the price is actually higher than NumberOfTokens * CurrentPrice. That is because as each token is purchased the price increases with the next token. Therefore, the bonding curve contract calculates the total price of the requested tokens as a sum of prices along the interval of supply numbers called for by the purchase. For example, suppose the current supply is 5000 tokens and the buyer wants to purchase 100 tokens. The buyer will have to pay the sum of the prices defined along the continuum from 5000 up to 5100. The buyer then approves a single price for the total buy order of continuous tokens.
¶ Bonding Curves in the Sovryn Ecosystem
Bonding curves are an important tool in the Sovryn ecosystem. As Sovryn grows and subprotocols are developed, bonding curve contracts can be used to define and mint subprotocol governance tokens using SOV as the reserve token. The use of bonding curve contracts accomplishes two goals:
- Creates an economic link to SOV. A bonding curve creates a price link so SOV holders participate directly in the success of the subprotocol. As the subtoken gains in value, the bonding curve incentivizes more SOV to be locked into the contract to match the implied value of the subtoken. This demand indirectly creates a demand for SOV, which lifts its value. SOV stakeholder participation makes sense as an economic incentive because SOV holders are the ones ultimately responsible for the development of the ecosystem and the costs and successes of any subprotocol on Sovryn.
- Concentrates incentives in the subtoken. Subprotocol stakeholders should most directly experience the benefits of success or pain of failure as important market feedback. Market signals would be diluted without a subtoken because the value of SOV is not dependent on a single subprotocol. Subtoken price is an important signal to monitor for success or failure. In this way subprotocol stakeholders are most directly rewarded for taking action leading to success or penalized for taking action leading to failure. SOV stakers will also experience price pressure on SOV, but each subprotocol is only one of many influences on the price of SOV.
¶ MYNT Bonding Curve
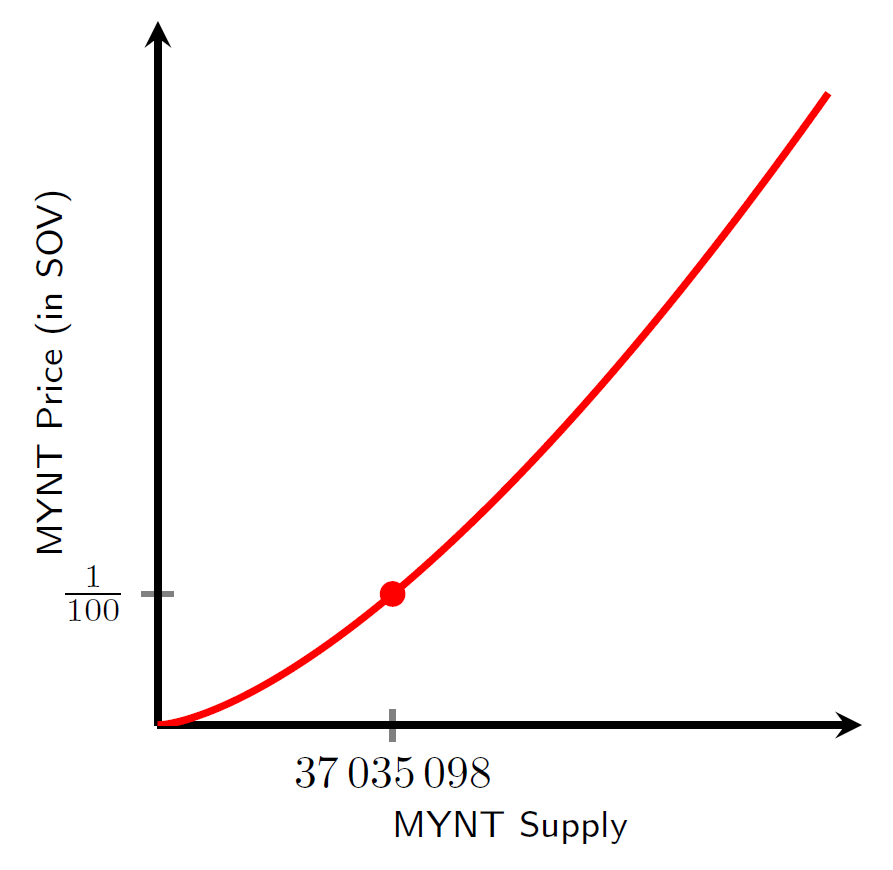
The MYNT bonding curve serves as a good example of bonding curves on Sovryn. The bonding curve is based on the Bancor formula. This formula sets the current MYNT price so that the ratio between the total price paid for all tokens in the current supply and the current market capitalization is a constant called the reserve ratio. The reserve ratio controls the shape of the bonding curve. For MYNT, the reserve ratio is 0.4. For a given supply s, the current MYNT price is given by


This amounts to a slightly upward curve everywhere. The 100 in the formula corresponds to the initial 100 MYNT tokens per SOV, and the 37035098 is the initial supply raised in the presale.
Notice that the price grows more rapidly than the supply.
If MYNT is sold back to the bonding curve contract, MYNT tokens are burned. This reduces the supply and therefore the price. You can learn more about the MYNT token parameters and bonding curve mechanics here. You can also explore the behavior of the MYNT bonding curve for various supply levels.
¶ References
Yos Riady, Bonding Curves Explained
Veronica Coutts, An introduction to bonding curves, shapes and use cases
“light” (and follow-up discussion), New utility for SOV: minting subprotocol tokens